|
|
SMALL BUSINESS: The businesses in our economy that individually produce very little output, have little or no market control, but collectively produce about half of our total production. Most small business owners may aspire to the ranks of the second estate, but they're card-carrying members of the third.
Visit the GLOSS*arama
|
|


|

|
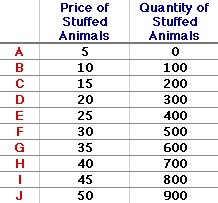
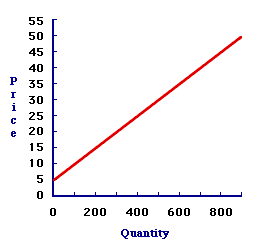
                           SUPPLY CURVE: A graphical representation of the relation between the supply price and quantity supplied, holding all ceteris paribus supply determinants constant. A supply curve graphically illustrates the law of supply, the direct relation between supply price and quantity supplied for a particular good. It is one half of the standard market model. A demand curve is the other half. A supply curve is a useful graph that can summarize several of the more important aspects of supply. It graphically illustrates the law of supply and when combined with the demand curve forms the market model, one of the most useful tools found in economic analysis.Plotting the NumbersA supply curve is commonly derived from a simple supply schedule, such as the one for stuffed Yellow Tarantulas, a cute and cuddly stuffed creature from the Wacky Willy Stuffed Amigos line of collectibles, shown in this exhibit. This schedule illustrates the law of supply relation between supply price and quantity supplied. As the supply price increases from $5 to $50, the quantity supplied increases from 0 to 900 Yellow Tarantulas.
| Supply Schedule | Supply Curve |  |  |
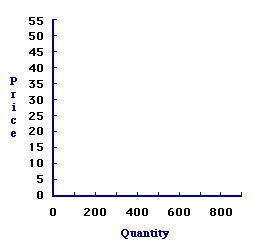
Transferring the price-quantity pairs from the supply schedule to a graph reveals the supply curve for stuffed Yellow Tarantulas. This task is easily accomplished by clicking the [Plot] button. A $5 price is associated with 0 stuffed animals, a $10 price goes with 100 stuffed animals, and on it proceeds, until finally a $50 price is paired with 900 stuffed animals.The supply curve is finalized by connecting these 10 points with a continuous line. The 10 prices corresponding to these 10 points, are but 10 of an infinite number of prices, each with a corresponding quantity. A continuous line includes these other possibilities. To reveal this line, click the [Draw] button. The end result is the supply curve. What It All Means |
Here are a few observations about this supply curve. - First, as the price increases from a low of $5 to a high of $50, the quantity supplied of Yellow Tarantulas increases from 0 to 900. Higher prices are related to larger quantities. This relation, this direct relation between supply price and quantity supplied, IS the basic law of supply.
- Second, the supply curve represents maximum quantities and minimum prices. That is, if the price is $10, then the maximum quantity supplied is 100 Yellow Tarantulas. It is not 150, nor even 101, but only 100. Alternatively, if sellers offer 100 Yellow Tarantulas for sale, then the minimum supply price they are willing and able to accept is $10, not $5, not even $9.99, but $10.
- Third, this whole curve, every price-quantity combination on the curve, is supply. Supply is the entire range of prices and quantities, all pairs. Supply is the entire curve. In contrast, quantity supplied is any specific number of Yellow Tarantulas sellers are willing and able to sell at a specific supply price. Selecting a different price generates a different quantity supplied. Quantity supplied is a point on the curve.
- Fourth, this supply curve represents hypothetical possibilities. It suggests a "What if" relation between supply price and quantity supplied. It indicates quantity supplied given a supply price, or supply price given the quantity supplied. If, for example, the supply price is $10, then sellers are willing and able to sell 100 Yellow Tarantulas. This does not mean that sellers will sell, are selling, or ever will sell 100 Yellow Tarantulas. It only indicates what they would sell at a $10 price.

Recommended Citation:SUPPLY CURVE, AmosWEB Encyclonomic WEB*pedia, http://www.AmosWEB.com, AmosWEB LLC, 2000-2024. [Accessed: May 5, 2024].
Check Out These Related Terms... | | | | | | | | | |
Or For A Little Background... | | | | | | | | | | | | | |
And For Further Study... | | | | | | | | | | | | |
Search Again?
Back to the WEB*pedia
|


|

|
RED AGGRESSERINE
[What's This?]
Today, you are likely to spend a great deal of time lost in your local discount super center trying to buy either a T-shirt commemorating last Friday (you know why) or a rotisserie oven that can also toast bread. Be on the lookout for bottles of barbeque sauce that act TOO innocent.
Your Complete Scope
This isn't me! What am I?
|

|
|
Three-forths of the gold mined each year is used to manufacture jewelry.
|

|
|
"Each of us is issued but one life, and we know full well how it all ends. It would be regrettable to squander this one chance on someone else's appearance, someone else's experience. " -- Joseph Brodsky, Writer
|

|
IBEX-35
Stock Index (Spain)
|

|
|
Tell us what you think about AmosWEB. Like what you see? Have suggestions for improvements? Let us know. Click the User Feedback link.
User Feedback
|


|


